Most delivery teams aren’t short on data. They have a carrier portal, a few exports and a dashboard someone built last year, and they still find out about late orders from a one-star review. The numbers exist. They just aren’t pointed at the thing that actually costs money, which is the late order. Fixing that starts with the numbers inside your last-mile operations.
This guide keeps it practical. First, what logistics KPIs are and why one late order hurts more than it looks. Then the 7 KPIs that warn you before an order goes late, how to track them without drowning in spreadsheets, and the three mistakes that keep orders late even when you measure everything.
What Logistics KPIs Really Are And Why Late Orders Cost So Much
Logistics key performance indicators (KPIs) are numbers that tell you how well one part of your delivery process is doing its job. On-time rate is one. Cost per order is another. Each one tracks a promise you made to a customer, and good supply chain management mostly comes down to watching those promises across the whole trip.
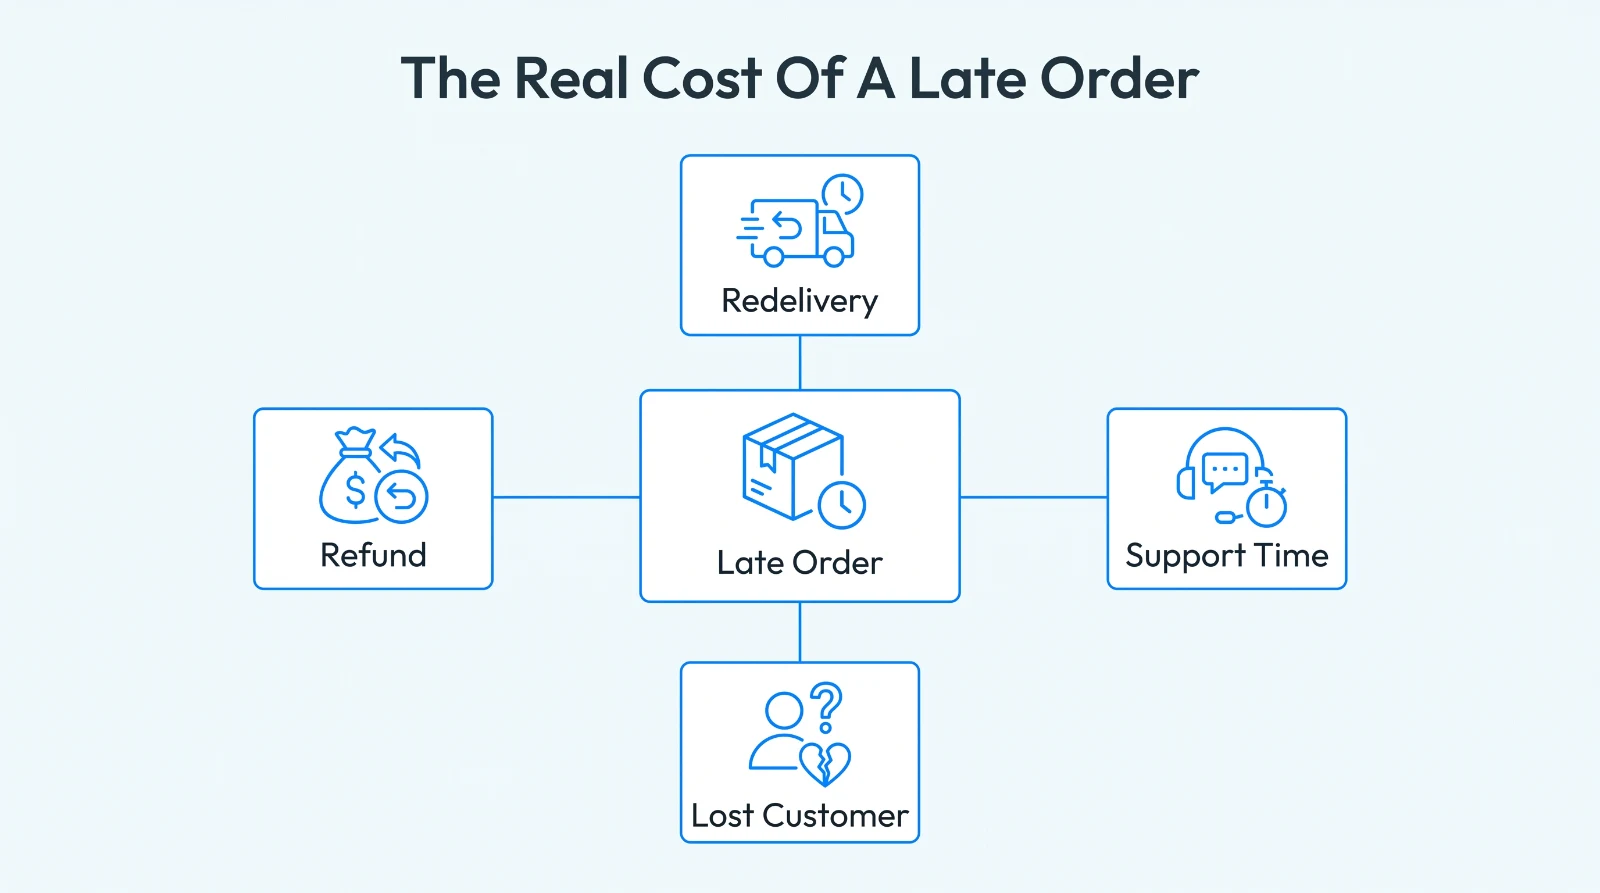
A late order is hardly ever one clean miss. It builds up somewhere between the first and last mile, and by the time the customer is annoyed, the money has already gone.
Most of that money never shows up on the shipping invoice. You pay for the refund, then the second delivery, then the support call. Sometimes you pay with a customer who simply doesn’t order again, which is the most expensive one and the hardest to see.
Add it up and one late order can cost several times what the delivery itself cost. Returns go up too. One analysis found that returns rise by about 1.1% for every day a delivery is late. Spread that across a busy month and it stops being a rounding error.
| What You See | What It Actually Costs |
|---|---|
| A missed delivery window | A refund or a discount to save the order |
| One re-delivery attempt | Double the delivery cost on that order |
| A support ticket | Staff time and a frustrated buyer |
| One bad experience | A customer who never reorders |
The right KPIs pull that hidden cost out where you can see it, and once you can see it you can do something about it.
7 Essential Logistics KPIs Every Team Should Track to Avoid Late Orders
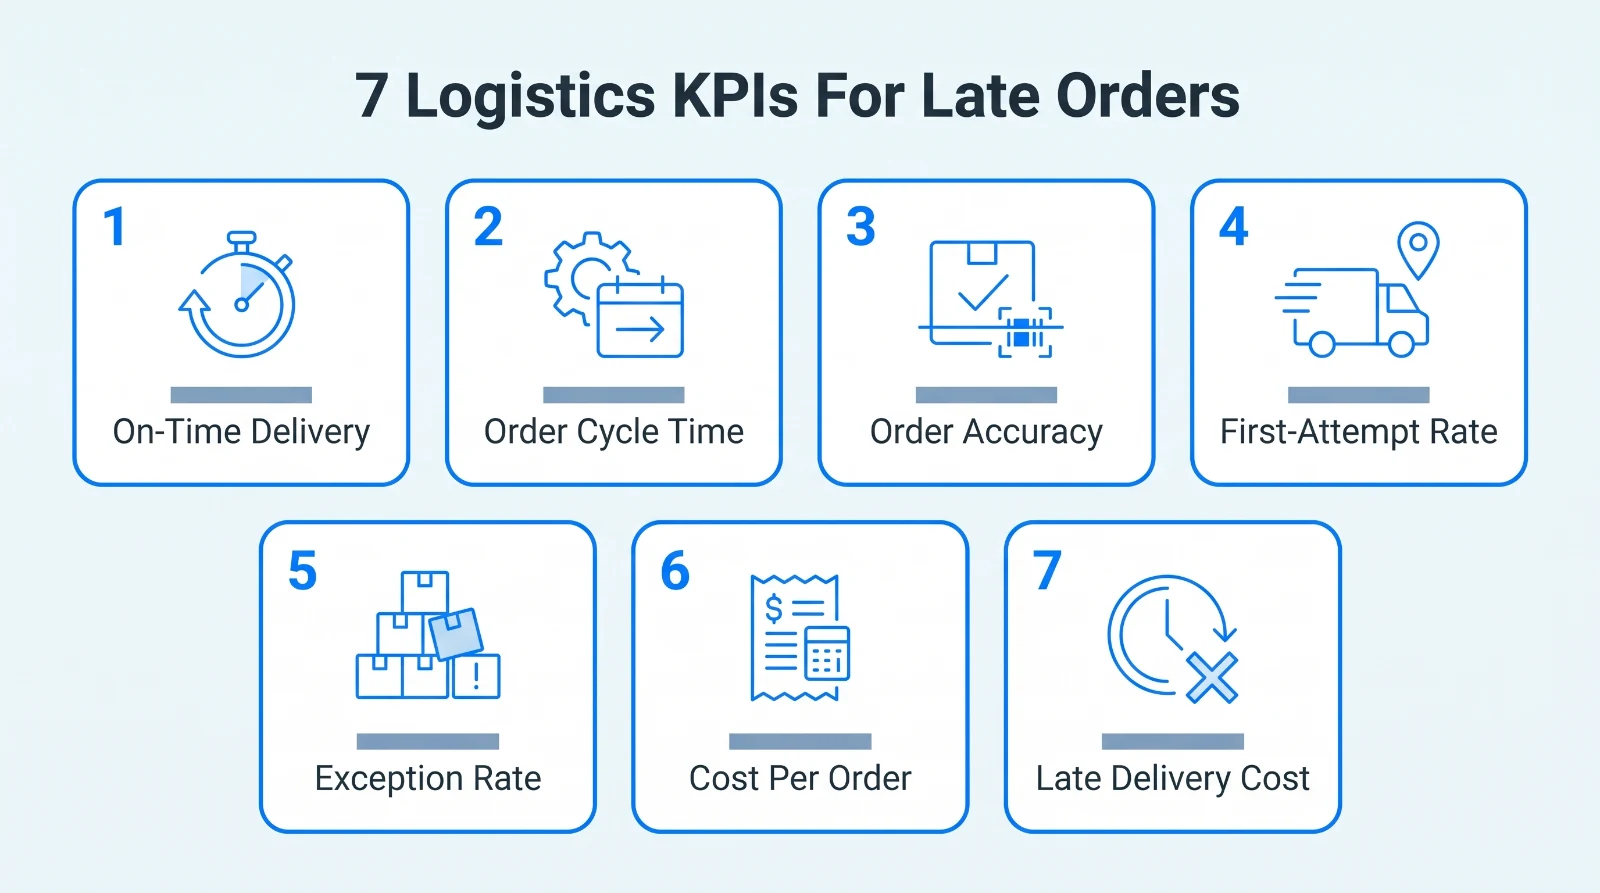
These are the KPIs that flag a late order while you can still do something about it.
1. On-Time Delivery Rate
This is the headline number for late orders: the share of deliveries that arrived by the date you promised. Customers notice the moment it drops, and the refund requests follow. A bad week here shows up in your reviews and your repeat orders for months afterwards.
Most of this number comes down to how well your routes are planned. That’s why route optimization does so much of the heavy lifting on on-time rate, and on customer satisfaction along with it.
How to Calculate: On-Time Delivery Rate = (On-Time Deliveries ÷ Total Deliveries) × 100
What to Keep in Mind:
- Best-in-class carriers hold 95% to 98% on-time.
- Below 90% usually means you have a real late-order problem.
- Many retailers treat 95% as their minimum service level.
How to Improve It:
- Base delivery promises on real route data, not on optimistic guesses.
- Optimize routes every day so drivers can actually hit the windows you promised.
- Flag at-risk orders early and reassign them before the deadline passes.
- Split your on-time rate by lane to find the routes that are always weak.
2. Order Cycle Time
Order cycle time is the full clock, from the moment an order comes in to the moment it reaches the door. On-time rate tells you whether you were late. Cycle time tells you where the time went.
Long or jumpy cycle times are where late orders start. If you ship finished stock off a shelf, the clock is mostly transit. As soon as you sell anything made to order, the clock starts long before a box moves.
Take this company making custom compression socks for sports teams and corporate orders. There’s a 72-pair minimum and a 2 to 4 week production run before anything ships. If a business like that only measured shipping speed, its on-time rate would look great while real customers waited three weeks.
For them the risk isn’t in the van at all. It sits back in production: a proof that never got approved, a fabric order that turned up late. So the cycle-time clock has to start when the order comes in, not when it ships. The customer remembers the whole wait anyway. Nobody thinks “well, the shipping part was quick.”
For stocked products, inventory turnover and warehouse capacity are worth a look here too, because a full warehouse slows picking and that time lands in the cycle.
How to Calculate: Average Order Cycle Time = Total Time From Order To Delivery ÷ Number Of Orders
What to Keep in Mind:
- Domestic eCommerce often runs 2 to 5 days door to door.
- Same-day and last-mile models squeeze this into a few hours.
- Faster competitors increasingly treat two days as the ceiling.
How to Improve It:
- Measure the full clock from order placement to doorstep, not just shipping.
- Break cycle time into stages to see where orders actually stall.
- Cut the handoff delays between packing and dispatch.
- Set a time target for each stage so one slow step gets noticed quickly.
3. Order Accuracy Rate
Order accuracy is about getting the contents right: the share of orders that go out correct and undamaged. A very fast delivery of the wrong item is still a failed delivery.
This KPI protects your late-order numbers more than most people expect. Every wrong shipment becomes a return plus a second delivery, which is a late order with an extra bill attached. When returns suddenly spike, the cause is usually picking errors rather than fussy customers.
How to Calculate: Order Accuracy Rate = (Error-Free Orders ÷ Total Orders) × 100
What to Keep in Mind:
- Best-in-class fulfillment reaches 99.5% accuracy or higher.
- Most healthy operations stay above 99%.
- Below 97%, returns and refunds start to get expensive.
How to Improve It:
- Scan barcodes at pick and pack to catch most wrong-item errors early.
- Check a daily sample of outgoing orders against what customers actually ordered.
- Trace every error back to the picker or station that caused it.
- Fix confusing SKUs and bin layouts. Putting popular items where they’re easy to reach also cuts picking delays.
4. First-Attempt Delivery Rate
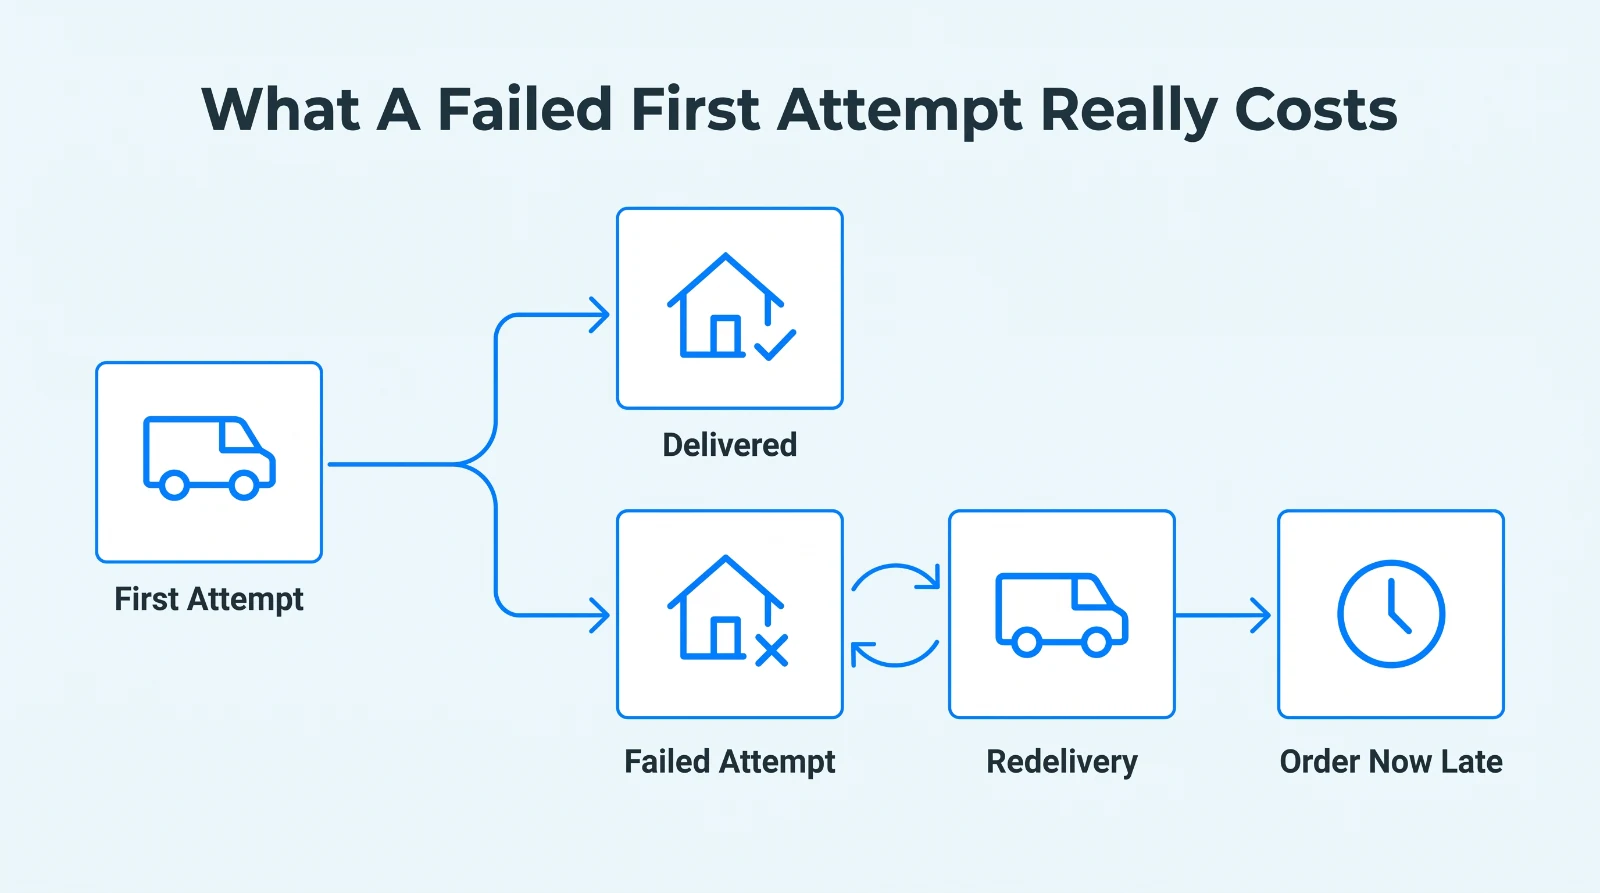
This one tracks how often a delivery succeeds on the first try. A failed attempt is pure waste. The driver leaves with the parcel still in the van, the order is now late, and you pay to send it out again. Most failures trace back to a bad address, which is about as avoidable as problems get.
It’s also one of the most expensive problems in last-mile delivery. Research from Loqate found that a failed delivery costs retailers an average of $17.20 per order once redelivery and handling are counted. Dispatch tools like Onro help here by confirming the drop and tracking the driver live, and we’ve written a separate guide on handling failed deliveries if this is your biggest leak.
A lot of failed attempts happen because the recipient never really knew the driver was on the way, or had no easy way to say “not today.” That gap is what Onro’s AI Recipient Agent is built for. It messages the recipient on WhatsApp as the order moves and shares a live ETA. If the timing doesn’t work, they can reschedule or change the drop-off address in the same chat, and they can leave a note for the driver too. Most of those problems get sorted before the van even sets off.
How to Calculate: First-Attempt Delivery Rate = (Deliveries Completed On First Attempt ÷ Total Deliveries) × 100
What to Keep in Mind:
- Strong last-mile operations deliver 90% or more on the first attempt.
- Urban B2C delivery usually lands between 85% and 90%.
- Every point you lose here adds redelivery and storage costs.
How to Improve It:
- Confirm the address and a delivery window before the driver sets off.
- Send live tracking and an accurate ETA so someone is actually home.
- Offer a safe place or a trusted neighbor option for when nobody answers.
- Validate addresses at checkout to remove the most common cause of failure.
5. Delivery Exception Rate
An exception is any shipment that runs into a problem on the way, like a wrong address or a weather hold. On-time rate only tells you an order was late after the fact. Exception rate warns you while there’s still time to fix it, and that head start is the whole reason to track it.
How to Calculate: Delivery Exception Rate = (Shipments With An Exception ÷ Total Shipments) × 100
What to Keep in Mind:
- Well-run networks keep exceptions under 5% of shipments.
- Peak season can push this into double digits.
- Above 10% usually points to address or planning gaps.
How to Improve It:
- Watch exceptions as they happen instead of reading about them next week.
- Tag each exception by cause so patterns show up fast.
- Give your dispatchers clear playbooks for the most common exception types.
- Fix the root cause, not just the one late shipment.
6. Average Delivery Cost Per Order
This is what each delivery actually costs you: total outbound delivery spend divided by the orders you got out the door. Late orders push it up fast, because every redelivery and rush shipment lands right here. Leave it alone long enough and it decides whether a delivery business makes money at all.
For most delivery setups it’s also the biggest single cost. One report found last-mile now makes up 53% of total shipping costs. Bringing that down is the center of any real last-mile strategy.
How to Calculate: Average Delivery Cost Per Order = Total Delivery Cost ÷ Orders Delivered
What to Keep in Mind:
- Last-mile alone can take more than half your shipping budget.
- Costs swing widely by delivery zone and parcel weight.
- Route density lowers cost more than anything else.
How to Improve It:
- Batch nearby stops so each route drops more orders per mile.
- Match vehicle size to the route instead of sending vans out half empty.
- Steer suitable orders to cheaper delivery windows or nearby pickup points.
- Track cost per order by zone to find where you lose the most.
7. Late Delivery Cost Rate
This is the KPI almost nobody tracks, and it’s really the point of this guide. It puts a money figure on lateness itself: add up the refunds and penalties caused by late orders, then compare that to revenue.
Most logistics managers can feel the cost of late orders without ever putting a number on it. Once the number is on a screen, lateness stops being an ops headache and becomes a finance problem, and finance problems get attention. Read it next to your other financial KPIs and you’ll see how much late deliveries are eating into profit.
How to Calculate: Late Delivery Cost Rate = (Cost Of Late Deliveries ÷ Total Delivery Revenue) × 100
What to Keep in Mind:
- Few teams measure this, so even rough tracking puts you ahead.
- Refunds and penalties on late orders add up quickly.
- Anything above a few percent of revenue deserves urgent attention.
How to Improve It:
- Log every refund and penalty that’s tied to a late order.
- Put a real money figure on lateness so leadership reacts.
- Rank late-order causes by cost and fix the most expensive one first.
- Review the number monthly with operations and finance in the same room.
How To Track Logistics KPIs Without The Chaos: 3 Easy-To-Follow Strategies
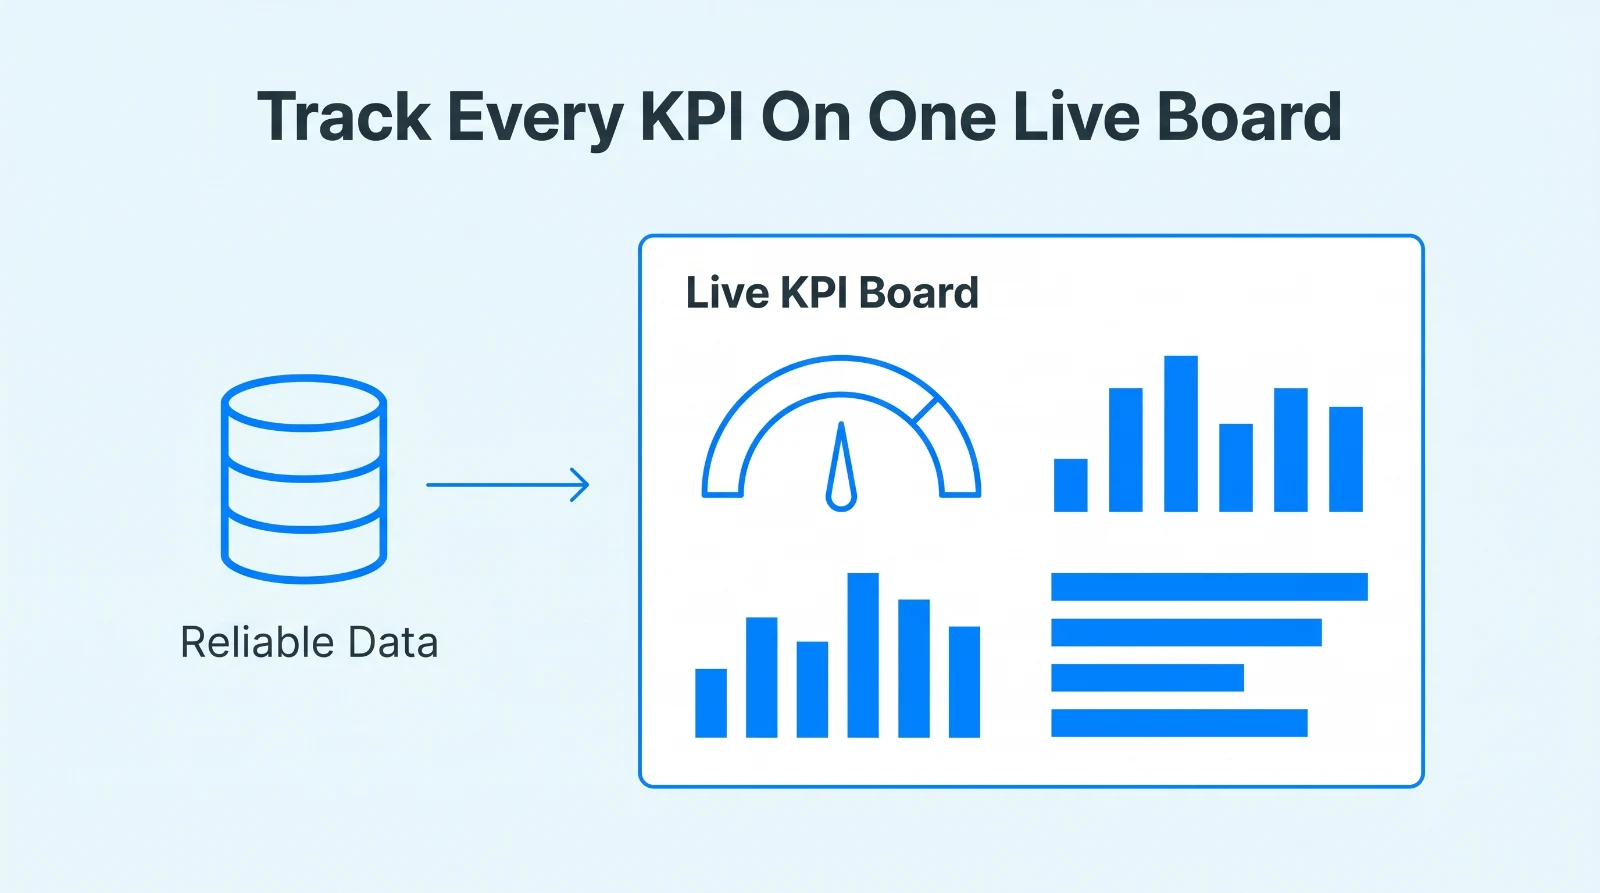
Knowing which metrics matter is half the job. The other half is putting them somewhere you’ll actually look before a late-order trend becomes a real problem.
1. Pull Every KPI Onto One Live Board
Most teams already have the data. It’s just spread across a carrier portal and a couple of analytics tools nobody has opened since Tuesday. When KPIs live in different places, nobody sees the full picture until it’s too late.
A KPI you check once a month might as well not exist. What you want is one shared board where every delivery number updates by itself, in front of the whole team.
Plenty of ops teams already run their work on monday.com, and it’s a good home for this. It’s visual, everyone is already in it, and it can hold the whole delivery workflow. The catch is that a blank board doesn’t fill itself. Someone has to get the data flowing in, build views that read like KPIs and set up the automations that flag a slipping number. Without that, most teams end up with a nice-looking board that somebody updates by hand every morning.
That’s the gap a monday.com consultant fills. They connect your delivery data, handle the integrations and automations, and turn the board into a live KPI view that keeps itself current. No dispatcher copy-pasting numbers at 7 am, and no developer on the payroll.
2. Keep The Data Underneath Fast And Trustworthy
A dashboard is only as honest as the data behind it. Under every KPI there’s a database quietly storing orders and timestamps, and everyone forgets it exists until it slows down or falls over.
That tends to happen at the worst time. As order volume grows, the database starts to strain. Queries that used to be instant get sluggish, and your live dashboard drifts a few minutes behind reality. A KPI that’s a few minutes late is itself a late warning. If the database goes down at peak, you lose sight of the whole operation on your busiest day, exactly when you most need to spot a late-order trend.
Keeping that layer fast is a specialist job, and almost no logistics team has a database expert in-house. An outsourced DBA covers that. They monitor and tune the databases behind your systems around the clock, so performance stays steady and uptime stays high. For a team that leans on live KPIs, it means dashboards that load straight away and numbers you can trust at 2 am in peak season.
3. Track In Real Time, Not At Month-End
A KPI you review once a month is a history lesson. By the time the report lands, the late orders have happened and the customers have gone.
Watching the same numbers daily turns them from a post-mortem into something you can act on. You can reroute a stalled order or message a customer before the deadline passes, not after. That’s the whole point of tracking these KPIs: catching problems while there’s still time to fix them, and getting a little better every week instead of once a quarter.
3 Logistics KPI Mistakes That Keep Orders Late + How To Fix Them
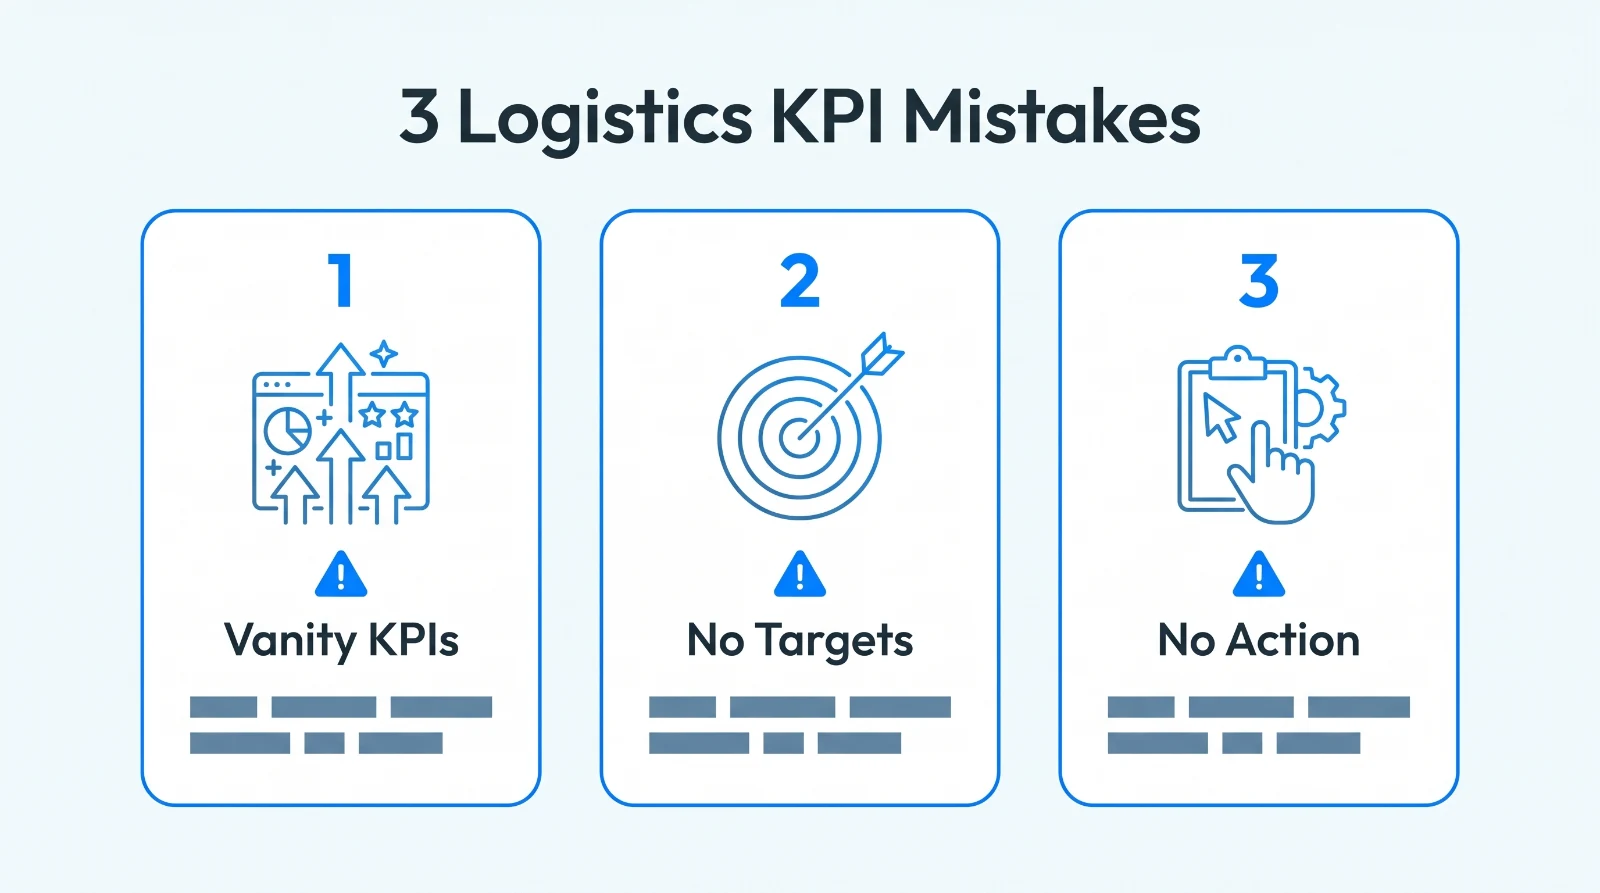
Even a good KPI list is useless if you use it the wrong way. These three mistakes keep orders late no matter how much you measure.
1. Watching Vanity KPIs That Ignore Late Orders
It’s easy to fall for metrics that look impressive and say nothing. Total shipments handled or miles driven feel productive, but neither tells you whether an order arrived on time. A busy-looking dashboard is comforting, which is exactly what makes it dangerous. You can hit every vanity target while late orders keep slipping through.
How to Fix: Tie every KPI to a late order or a cost. If a number can’t change a delivery decision, drop it. Keep the short list that actually predicts lateness and transportation costs.
2. Setting No Target So A Number Means Nothing
A KPI without a target is trivia. You can’t tell whether a 92% on-time rate is great or a slow-moving disaster. Without a benchmark, nobody knows when to act, so the number goes on a slide every month and changes nothing.
How to Fix: Give every KPI a target and a red line. Take your benchmarks from your own best months and from sensible industry ranges. Then a number stops being data and becomes a pass or a fail, and a fail means someone does something.
3. Tracking Everything But Acting On None Of It
Some teams build beautiful dashboards and admire them every week while nothing changes. The late-order rate stays red for months, because watching a problem isn’t the same as fixing it.
How to Fix: Give each KPI one owner, not a committee. When a number crosses its red line, that person owns the fix and reports back. A KPI with no owner and no next step won’t move.
Conclusion
You don’t need 20 logistics KPIs. You need the four or five that touch late orders, on one live view, checked every week. Give each one a target and an owner, and late orders stop being a mystery. They become a number you can manage.
At Onro, we build the delivery management software that produces most of these numbers for you. It runs dispatch and route optimization, with live tracking and proof of delivery on every drop, so your on-time and first-attempt rates are measured without anyone building a spreadsheet.

Try Onro for Free
Get your free access to the Onro All-in-one Last Mile Delivery Software.